What you’ll get
- A principled, dispassionate way to approach trade partners and their business.
- Enhanced salesforce productivity.
- An objective decision-making framework on where and how to spend trade, scheme and product-marketing budgets.
- A chance to do away with the one-size-fits-all approach and introduce a cohort-based reward system.
Your biggest dealer may not be your most loyal one
Two dealers sit on your sales report.
The first does ₹2 cr a year with you. He’s at the top of every review, and he gets the best schemes, the most visits and the warmest welcome at the dealer meet.
The second does ₹20 lakh. He barely gets a mention.
Now look one level deeper. The first dealer’s business is far bigger than what he buys from you, and you’re 15% of his wallet. The other 85% goes to your competitors. The second dealer gives you 80% of his.
Which one is loyal? Which one could you lose tomorrow? And which one could you grow?
Size is mistaken for loyalty. That one mistake decides where most sales teams spend their time, their visits and their scheme budgets.
From Part 1 to Part 2
Part 1 was dedicated to the retail-end customers/shoppers. It answered “who are my best customers, and how must I engage most effectively with them?”
B2B and the trade-partner fraternity have their own nuances and need to be looked at differently. So Part 2 answers three questions:
- Where should my next promotion rupee go?
- How must I plan my partner visits, engagements and Permanent Journey Plan (PJP)?
- How must I incentivise partners according to their potential and the organisation’s objective?
Why dealers need their own framework
RFM was built for shoppers. Dealers aren’t shoppers. Seven differences matter.
1. Size isn’t loyalty. Big dealers are usually multi-brand. What matters is your share of their wallet, not their turnover.
2. Few, big, concentrated accounts. A handful of dealers can carry half your business. Each one is a relationship, not an anonymous segment.
3. A dealer is a reseller, not a user. Their orders follow their own sell-through, stock and cash, not their consumption. A dealer is also your route to end customers: lose one, and you can lose a whole catchment.
4. Trade schemes influence frequency and spend. Schemes, targets and quarter-end pushes lift orders without real sell-through.
5. Every dealer has its own rhythm. Project-led orders are chunky, might happen once in a while . A dealer can look lapsed for three months, then place a big order. One recency cut-off for every dealer is not an accurate representation.
6. Revenue isn’t value. Margin after schemes, credit days, returns and the cost to serve all change the dynamics. Heavy discounts and big credit days can make a big dealer worth less than a mid-sized one who pays in advance or in weeks.
7. A dealer’s potential is visible. You can estimate how much a dealer sells in your category across all brands, from their size, their market and their footfall. That tells you how much more you could win. RFM alone never shows it.
The six measures, and why each one
RFM-B² keeps RFM’s three measures and adds three. Each one answers a difference above.

Why analyse measures that move together?
- Monetary and wallet share. Big dealers tend to score high on both. Keep both anyway, so you’re blinded to neither scale nor potential.
- Absolute and % gross margin. Together they show which lever to work. High absolute margin with low % margin means the partner does the heavy lifting only through schemes and fast-moving items, not high-end goods. That’s bad for his profitability, for yours, and ultimately for the customer experience.
RFM vs RFM-B²: what changed for dealers

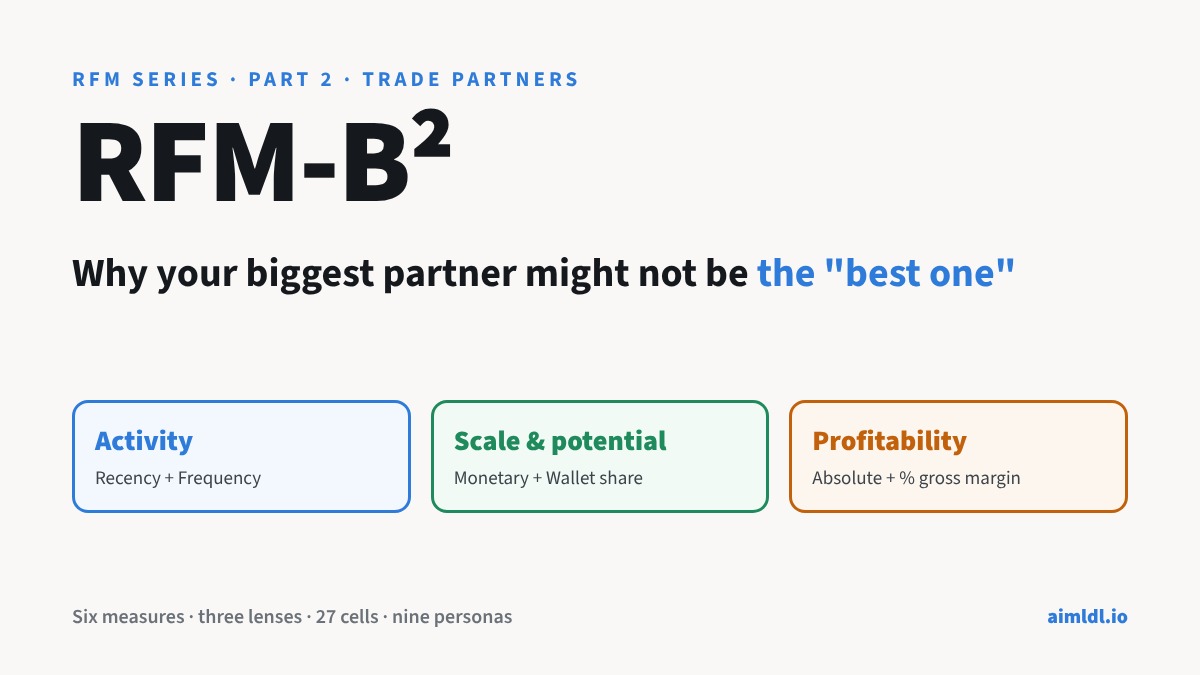
The six measures sit in three lenses, each answering one question:
- Activity (Recency, Frequency): are they still buying, and how regularly?
- Scale & potential (Monetary, Wallet share): how big are they for us, and how much more is there?
- Profitability (absolute and % gross margin): what do they earn us, and how healthy is it?

Proposed scoring rules: 1 to 5
The scoring rules for each of the 6 measures is being proposed however these can be defined specifically for your business.
Analysis is based on look back period of rolling 12 months.

Monetary is the one measure scored from the data, not from fixed bands. As in Part 1, take the log of each dealer’s revenue and let KMeans find five natural bands.
The log scaling compresses the data to ensure fair scoring for the partners. There is risk of lot of partners being awarded lowest score (1) because of some large partners skewing the mix towards very large values.
From scores to lenses to personas
How it works, in three parts:
- Part 1 scores six measures and reads them through three lenses.
- Part 2 places each dealer in one of 27 cells.
- Part 3 gives each persona its action. One example dealer runs through all three.


Actions that stand out when incentives follow personas.
- Coverage model becomes clear. Costly Tail and most of Gone Quiet move to a distributor, inside sales or digital ordering. The field team’s time goes to Business Sustainers, Ringfence Them and Potential Goldmine.
- Partner conversations get fairer. A partner can understand “you’re growing share profitably, so here’s your growth reward”. It’s far more productive than saying “you didn’t qualify for the slab”.
Putting the framework to work: an illustration on a public dataset
To show the framework end to end, I used a public dataset: Microsoft’s AdventureWorks reseller sales, a fictional bike manufacturer selling through 701 resellers. It covers 3,796 orders from Dec 2010 to Nov 2013, with schemes, margin and each reseller’s own annual sales. I merged three of its tables into one clean file, rfmb2b.csv, now on Kaggle.
Treat it as an illustration, not evidence. The data is fictional, margins are unusually thin, reseller sales come in five bands, and there are no payment, returns, category or geography fields. The numbers below show how the framework reads. They aren’t the benchmarks.
What the framework surfaces: four views of the sample
Four charts from the notebook, each followed by two actions a sales head could take.
1. Where the partners sit: the 27cell grid

Each panel is one Activity level. Inside it, rows are Scale & potential and columns are Profitability. Each box is one cell, coloured by its persona, with the number of partners in it.
Actions
- Rebuild the PJP around the green and yellow boxes. On the Fence and Potential Goldmine partners (110 here) are active and profitable, but you hold a small share of their business. They should get a fixed place in the visit plan before more time goes to partners who are already at full share.
- Win back the quiet partners who were worth having. Gone Quiet is the largest group (179), but only a few cells hold partners who were profitable before they went quiet (L/L/H, 15 here). Call those first; hand the rest to a distributor or digital ordering.
2. Business contribution by persona

Each bar is a persona’s share of net revenue, with the number and share of partners underneath.
Actions
- Start the scheme review with Volume Movers. They carry the biggest share of revenue (53% from 16% of partners here), so a change to their scheme mix or discount depth moves the business more than any other single decision.
- Ring-fence Business Sustainers. A small group (36 partners here) brings a large share of revenue at healthy margins. Give them a senior owner, a fixed slot in every PJP cycle and first access to launches, so a competitor never gets the opening.
3. The Pareto view

Bars show each persona’s share of revenue, largest first; the black line adds them up. The orange line marks 80% of revenue.
Actions
- Match engagement to the curve. The personas before the 80% line (43% of partners here) deserve direct, senior coverage. The flat tail after it (46% of partners, about 1% of revenue) is a case for distributor, inside-sales or digital coverage.
- Deep dive into the tail. It holds three different personas: grow Potential Goldmine, serve Costly Tail cheaply, and win back or hand over Gone Quiet. Split the tail by persona before deciding coverage.
4. Revenue isn’t the real value – margin is: one dot per partner

Each dot is a partner: net revenue from left to right (log scale), gross margin up and down. The black line is break-even.
Actions
- Rank partners on margin as well as revenue before the next scheme or incentive cycle. Here, 13 of the 20 biggest partners by revenue lose money. A revenue-only list would send them the most schemes and visits.
- Fix the bottom-right cluster first. The big partners below break-even (mostly Volume Movers) are where pricing, discount/rebate/TOD and product mix need a review. A small margin gain there is worth more than any amount of new volume from the tail.
Step by step: run it on your own partners
- Gather 12 months of invoice lines (partner, date, order number, net revenue after schemes, cost, scheme flag), plus a partner master with each partner’s total business.
- Clean: net off returns and credit notes, drop non-product lines, and tag scheme-driven orders.
- Fix the frame: set a snapshot date and a rolling 12-month window.
- Compute the six measures for every partner.
- Score each measure 1–5 using the rules above.
- Build the lenses: average each pair, then call it High, Mid or Low.
- Assign each partner a persona and its action.
- Act: feed the personas into the PJP, the scheme budget and the incentive slabs.
- Re-run every quarter. Most businesses, and their incentives, run on quarters.
The real signal is the movement. Compare each partner’s persona this quarter with last quarter’s. A partner drifting to a competitor shows up as a move before it shows up in the quarter’s numbers.

- Green, positive move: better on at least one lens and worse on none, or back from Gone Quiet. Recognise it.
- Orange, watch carefully: slipped on a lens, or a mixed move. Find out why before next quarter.
- Red, act now: gone quiet, scale or activity collapsed, or a Business Sustainer slipping. Chances are the business has already lost this partner.
What to add from your own data
The sample can’t show everything. Each field you add makes it richer and solves a problem:
- Range breadth (how many of your categories each partner stocks) gives you a cross-sell list per partner.
- Credit and payment days flag credit risk: partners whose payment behaviour is slipping.
- Factoring Returns keep revenues netted and realistic.
- Each partner’s own ordering rhythm, for project-led businesses, makes Recency fair to partners who order in large-lumps.
The bottom line
RFM tells you who your best customers are. RFM-B² tells you where your next rupee, your next visit and your next incentive should go, and which partners you’re about to lose.
What decision must you take: before the next scheme is announced, run the six measures on your partners and check which personas the money is about to reach and is it fair, justified, equitable, and inline with the business objectives.
Next in the series: RFM-B² is rule-based: you set the rules on six measures you already understand. Next, I’ll show unsupervised clustering, which is data-driven: the data forms the groups when you don’t know the rules in advance.
Get the code and data: GitHub · Kaggle notebook · Kaggle dataset
Data: Microsoft AdventureWorks sample (MIT License), fictional, used for illustration only.
Leave a Reply