Category: Statistics
-
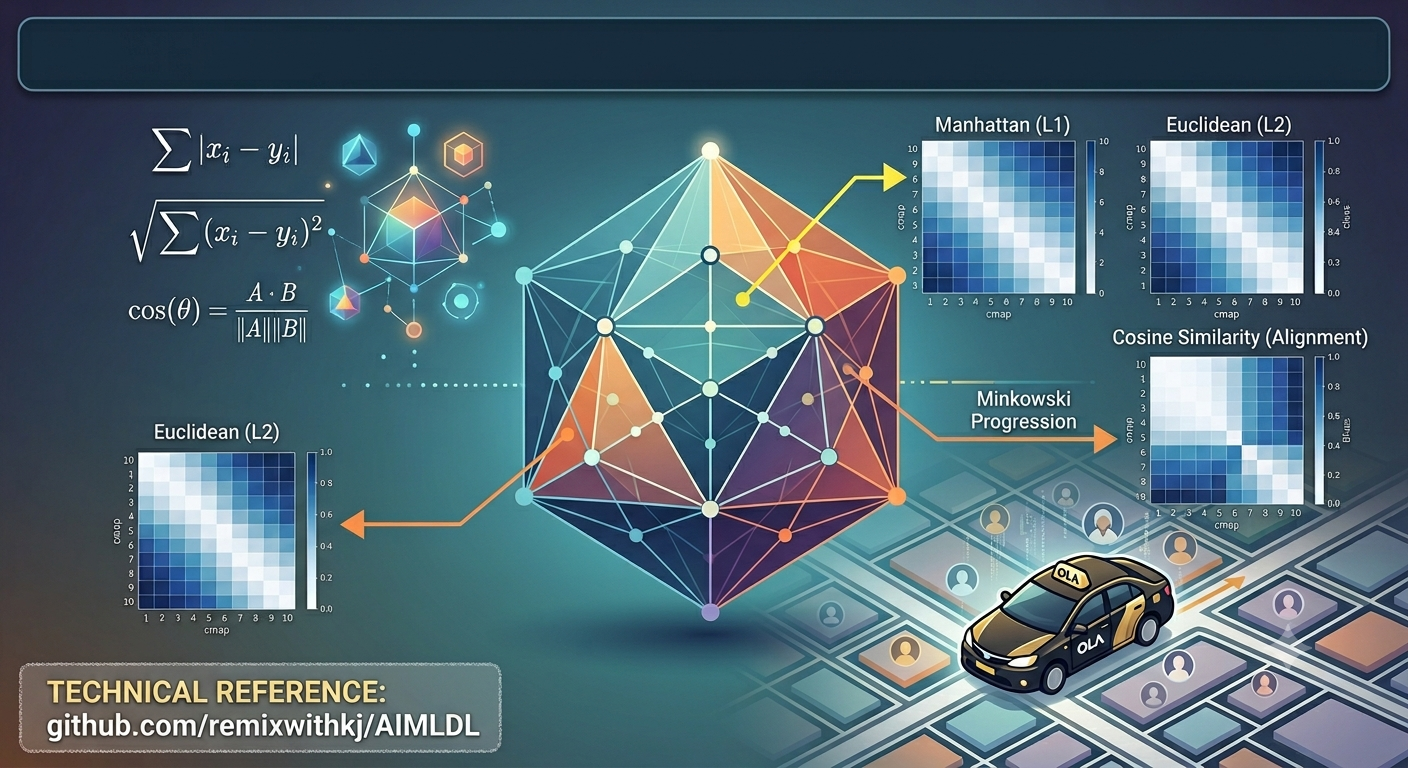
The Invisible Math Behind Personalization – Part 3: When a straight line ain’t enough!
In Part 1, we measured distance the way a ruler does. In Part 2, we taught the ruler about the shape of data: variables that move together, and populations that drift. But every metric so far has assumed one thing quietly: that the numbers sit on a flat sheet of graph paper. Location data doesn’t.…
-
The Invisible Math Behind Personalization – Part 2: When the shape of data matters
In Part 1, we measured distance the way a ruler does. Euclidean, Manhattan, Minkowski, Chebyshev, Canberra and Cosine all look at two customers, compare their numbers feature by feature, and return a single value. Rulers are honest, but they are also naive. A ruler does not know that long rides cost more, that airport trips…
-
The Invisible Math Behind Personalization: Notions of similarity or distance
Marketers face segmentation challenges by organizing various data entities like customers and products into actionable cohorts. Understanding how similar or different these entities are is crucial for effective decision-making. Distance and similarity metrics form the foundation of machine learning, enabling the transformation of raw data into valuable insights. Various algorithms utilize specific distance metrics, such…
-

Salesforce Effectiveness, most important features and multidimensional view
The transition to omnichannel retail has complicated the customer journey, necessitating a versatile salesforce. This statistical model evaluates sales managers beyond sales performance, incorporating various factors to enhance training and reduce churn. Utilizing synthetic data, it clusters the Sales Managerss to identify key features for effective management and improvement strategies.